Why a Google Solutions Architect Joined our Data Science and AI Bootcamp
AI, automation and data science are reshaping the tech industry. In this interview, Google Solutions...

AI, automation and data science are reshaping the tech industry. In this interview, Google Solutions...
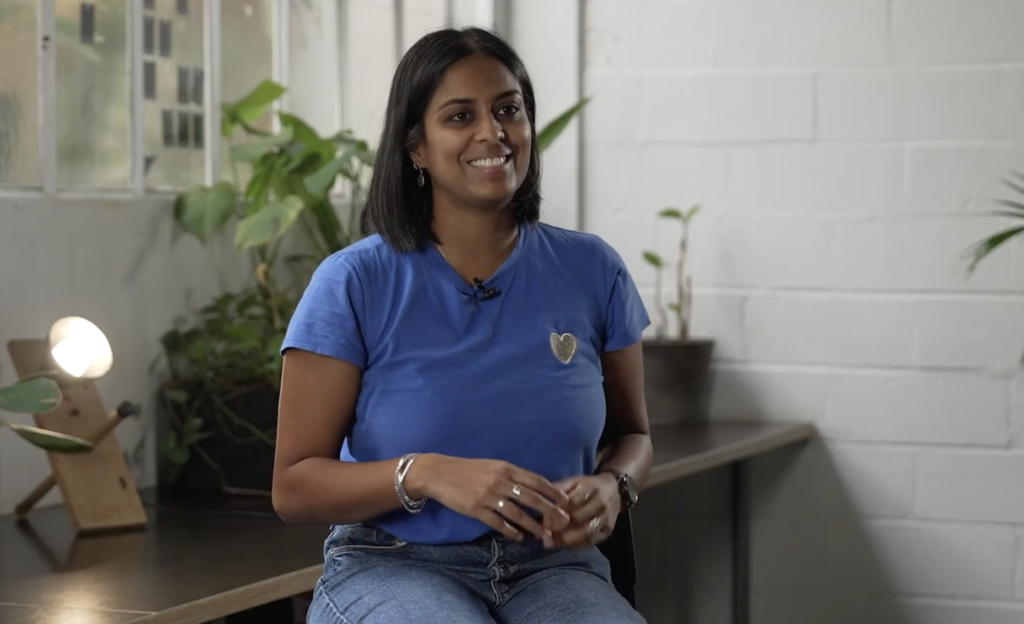
Christelle has a PhD in genetics. In April 2024, she did Le Wagon's Data Science...
Build AI-powered software from idea to launch with our practical AI Course. Learn by creating...